A major difficulty to figuring out whether we are out of the bear market is that most retail investors do this using personal instinct (aka ‘gut feel’). With developments in machine learning, we can now deploy algorithms to figure out which regime we are in at the moment.
How to tell where the market is now?
A straightforward way to identify the economic regimes that we are in would be to assume that markets can exist in two states:
- A “normal” state where markets are mostly predictable, and we can make money without losing too much sleep.
- A “crash” state where markets can lose the investor a lot of money and are highly volatile.
The last time we had a severe crash was in March 2020. However, markets have been trending down since April 2019, would we be able to employ a computer program to tell us which regime we are experiencing at the moment?
Algorithms to analyse regimes do exist, but the underlying maths is too complicated to be explained in one blog article. In layman terms, the computer must first filter out daily returns into broader trends. Where the trends are generally upward, the market would be in a “normal” state and where trends are downward, the market can be flagged to be in a “crash” state.
For the algorithm I deployed, I would have to finetune the sensitivity of the algorithm manually. If the program is too sensitive, then every day in which the stock market goes up, it would be flagged as “normal” and when the market is down for the day, it would flagged as a “crash”. Reduce the sensitivity too much, and the program will see the market in a broad upwards trends for the past two decades, rendering the model next to useless.
How is the STI doing now?
I was able to tune the algorithm to flag the regimes for the Straits Times Index using its proxy the STI ETF (Ticker: ES3) :
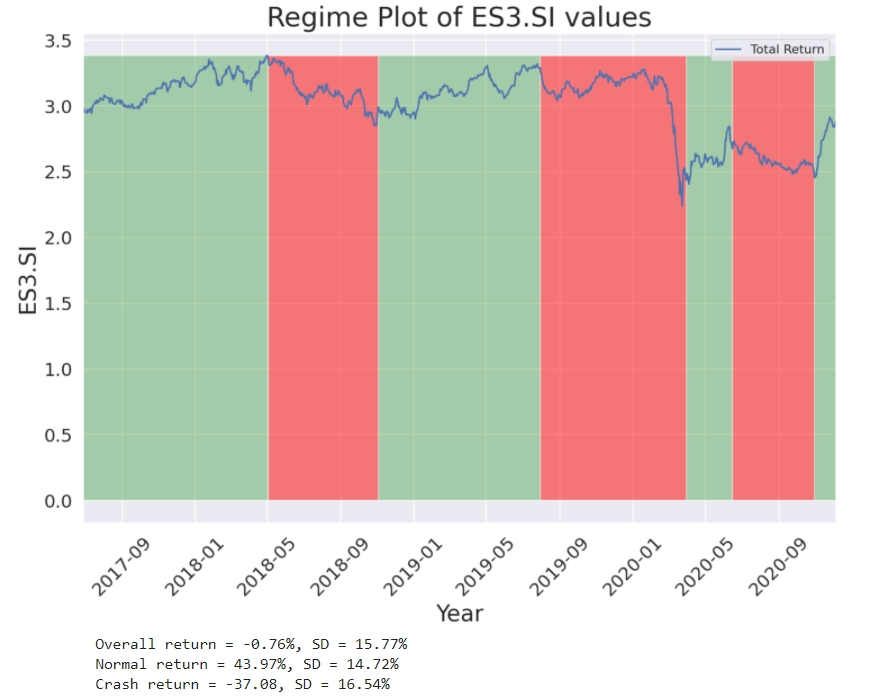
At this level of sensitivity, the program flagged a crash (red zone) that began in mid-2019 and ended on March 2020. There has been a smaller crash from around May 2020 to September 2020.
What is more interesting are the returns of the market in different regimes. When the STI was behaving in a normal state (green zone), returns can be quite attractive, generating annual returns of 43.97% with a risk of 14.72%. But returns are brought swiftly to earth during crash periods (red zone) that can see the investor lose -37.08% with elevated levels of volatility at 16.54%. Overall returns at -0.76% for the entire period is not impressive at all for many retail investors.
Another words, investing in STI is relatively profitable and safe provided we can invest throughout a normal regime. The good news is that at the time of writing the article, we have just emerged from a “crash” regime which, in my opinion, is possibly one of the most bullish reasons to invest before the end of the year.
How are REITS doing now?
Since we now have tuned algorithm that produces satisfactory results, we can look at other markets like the REIT market through the proxy Lion-Philips S-REITs (Ticker : CLR)
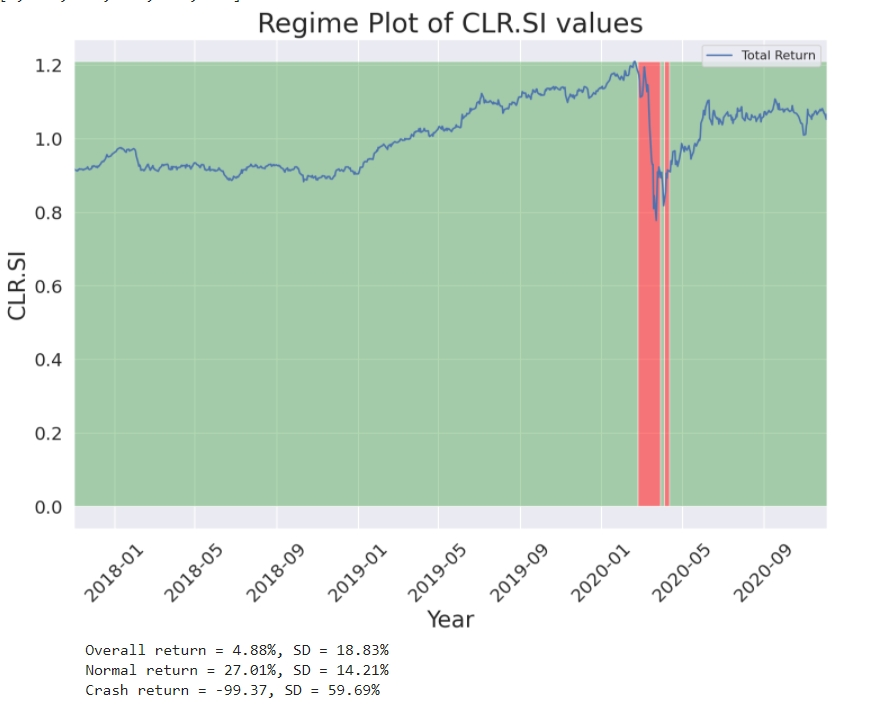
The beauty of REITs investing is evident when you can observe the regimes flagged using the same program parameters. REITs were generating great instruments returning 27% a year until the pandemic crash in March 2020, which can lose an annualised 99% with a volatility spiking to 59%. We knew that leveraged REITs investors had a momentary market rout during the pandemic and many were forced to unwind their positions at that time.
However, REITs never experienced a crashed again beyond April 2020, and things had been back to normal since. In my opinion, this is another good reason to enter the REITs market at this time.
How is Gold doing now?
But we’re not done for the model yet. For the model to work, there has to be an asset class that would be considered dangerous to invest in at this time. According to the program I tuned, look no further than Gold (Ticker : O87).
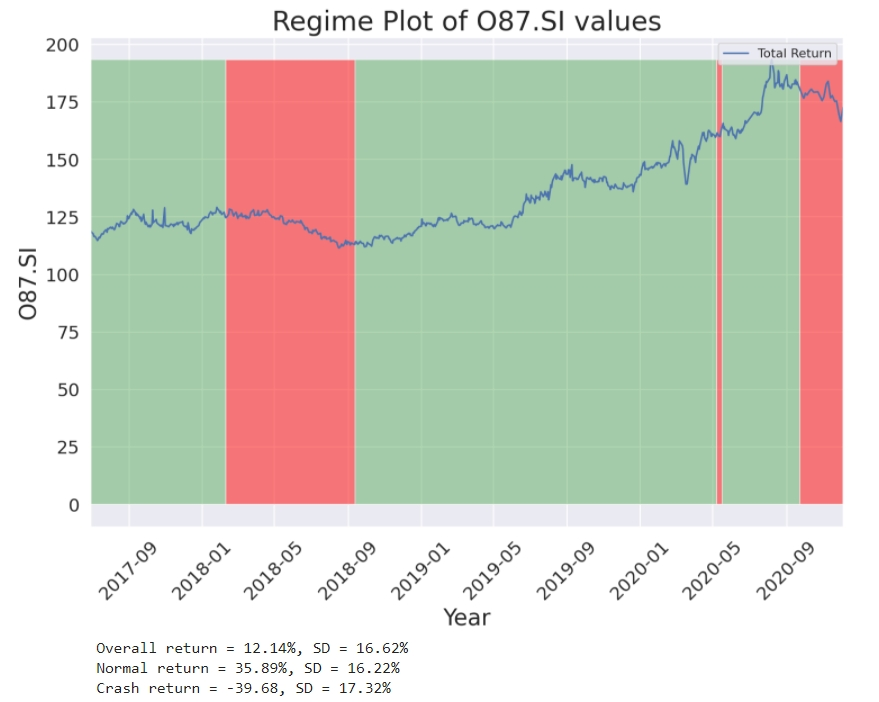
From what we can see in the diagram, gold is going through its mini-crash right now, and we can potentially see annualised losses of 39% if we buy gold from the markets.
In my opinion, it may be more prudent to wait out until the regime changes before repurchasing gold.
How are Bonds doing now?
To make the discussion more complete, I will put up just the diagram of the ABF Govt Bond Fund ( Ticker: A35.SI ):
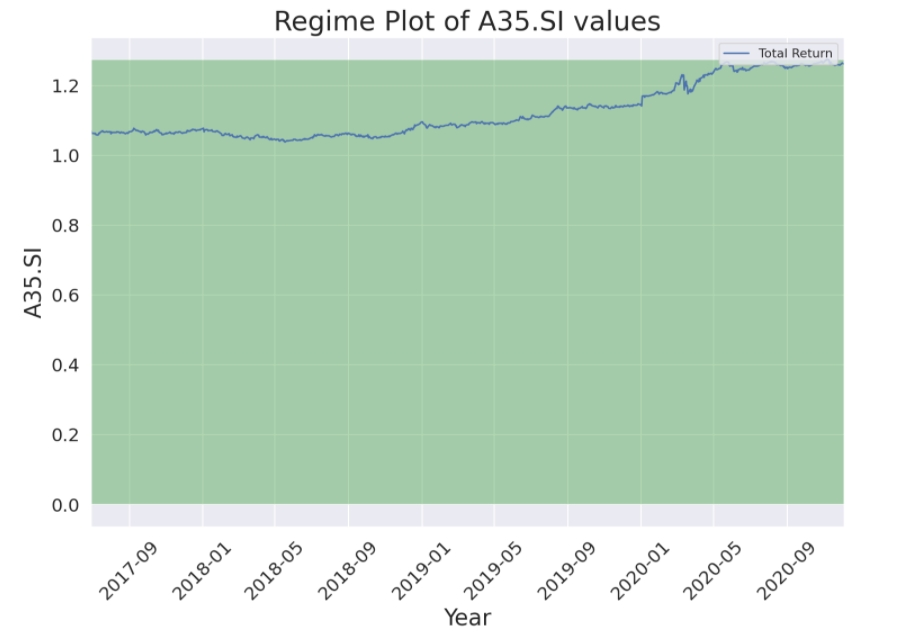
Bonds did not crash at all throughout the pandemic, which is why they make excellent diversifiers for our portfolios.
How is Bitcoin doing now?
Finally, I decided to go a little crazy and see whether this same regime analysis can be applied to Bitcoins (Ticker:GBTC).
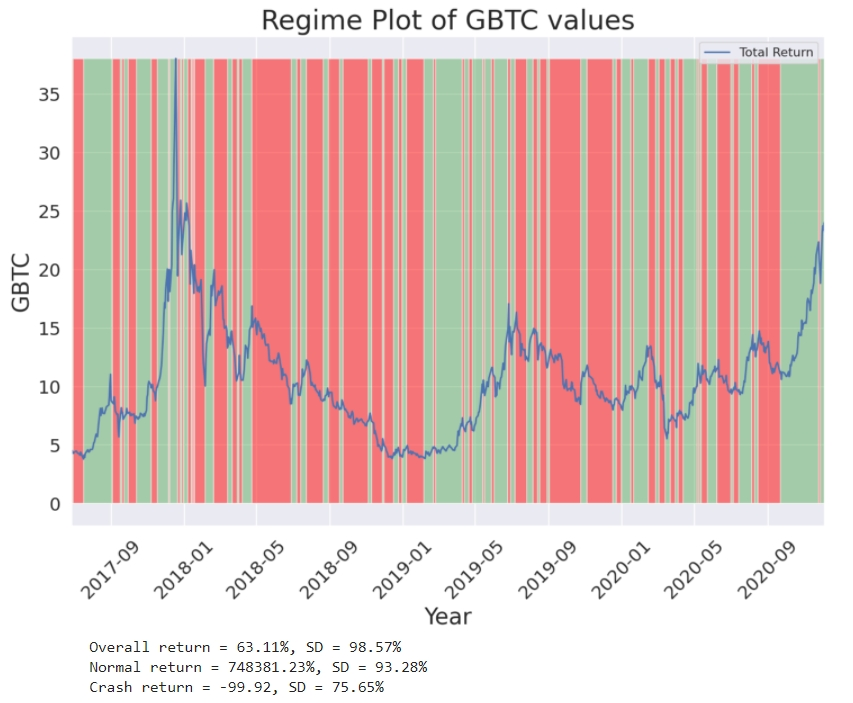
Bitcoin is so ridiculous as an investment as even my program can’t seem to find stable zones of normality and crash zone; every time-period comes with multiple crashes and upward swings. If you are a savvy bitcoin investor though, you can even come up with an argument that there’s money to be made right now because we are at a “green” zone. But do be careful and invest what you can afford to lose. Things can so south anytime with this asset class.
While the regime analysis tool I wrote on Python is good at flagging which regime we are currently in, it would probably not perform as well when predicting changes in such regimes from a “normal” regime to a “crash” regime. Regime changes can be triggered by events such as an election or changes in legislation. I suspect by the time the diagram flashes red, it would have been evident to the investor days before the fact.
Professional hedge fund managers will not make decisions using such crude measures derived from merely stock returns. They will probably combine it with more sophisticated techniques like sentiment analysis using text data mined from social media websites.
Are you ready for a post-pandemic bull-run?
In summary, we can analyse market returns by breaking markets into two periods: a normal period and a crash period. We can improve returns if we invest during normal periods and avoid investing during crash periods. So far, the regime analysis suggests that local blue chips and REITs are in a period of normality possibly signalling a post-pandemic bull-run, but gold is undergoing a crash regime.
Cryptocurrencies like Bitcoin tends to undergo multiple periods of normality and crashes, so investing in such instruments would require some care. So a good strategy may be perhaps to overweight local equities and REIT, underweight Gold, and to keep some remaining spare-change for cryptocurrencies.


Hi
Isn’t it good time to pick up good business during crash period?
There’s the danger of data-fitting to make the results appear what we want.
You can easily replicate this normal/crash signal with a dumb moving average with a buffer zone to dampen whipsaws. This again has the danger of data-fitting as one keeps on tweaking the “ideal” n-period moving average and whether to use exponential or some other weighted moving average, as well as the percentage buffer zone to best fit the data range used for the backtest.
MSCI website has 50 years of data for S’pore large caps, both price-only as well as total returns. You may want to use this dataset for your future backtests.
Unfortunately SG Reits doesn’t have that long a history.
Will be good to clarify this point “We can improve returns if we invest during normal periods and avoid investing during crash periods.” to all the readers out here.
The above only makes sense if you’re referring to active management of allocating equities to cash instead during crash periods.
My take will be to “hedge” with a % of cash to be deployed upon black swan events (crashes/dips) or even corrections on your wish list of stocks during black swan events, as long as fundamentals don’t change.
Even if one fails to adjust portfolio during such time, its merely unrealized loss; at the end of the day, as long as one does their research and have conviction in the stocks they invest in, they will sleep better for sure.