
Retail investors should be familiar with FTSE Straits Times Index (STI) while futures traders would prefer MSCI Singapore (SIMSCI). The purpose of these two indices is to provide a measurement of investment returns by selecting a basket of stocks listed on the Singapore Stock Exchange. The STI was constructed by Singapore Press Holdings and FTSE has refine the calculation with her methodology in recent years, MSCI is American while FTSE is British. Maybe because of Singapore’s British colony heritage that we chose to go with FTSE.
What is the difference?
I scoured through the methodologies briefly and found little differences in them. Both combined the elements of market capitalisation and liquidity (or transaction volume) to decide the stocks and their weightage in the indices.


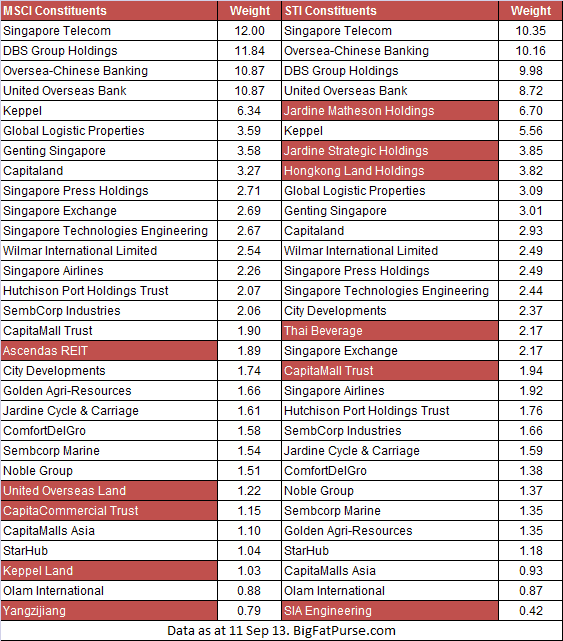
After scoring the Singapore stock universe, both indices came up with 30 constituents, and 25 of them are similar. See the constituents and the respective weightage in the table.
Which one to invest in?
Besides the popular SPDR and Nikko AM STI ETF, iShares MSCI Singapore ETF is also listed in SGX. Retail investors are able to invest in either indices. iShares MSCI Singapore ETF is also listed in New York Stock Exchange.
Most importantly, what are the returns? For the period of 31 Aug 2003 to 31 Aug 2013 (10-year), the annual returns inclusive of dividends are
- SPDR STI ETF: 9.92%
- iShares MSCI Singapore ETF: 12.97%
A first look tells us that iShares MSCI Singapore ETF has given an additional 3% annual returns in comparison to SPDR STI ETF! But do not be too happy yet. The iShares MSCI Singapore ETF is quoted in USD. If we convert to SGD, the returns will definitely reduce by a few percent since USD has devalued for so many years.
In addition, the cost of iShares MSCI Singapore is 0.55% while SPDR STI ETF is 0.3% per annum. Choosing a lower cost fund always makes more sense to your pocket.
Hence, if you ask me, I will prefer to stick to SPDR STI ETF. If I am an American, I may consider iShares MSCI Singapore ETF if I want exposure to Singapore equity market.


Thanks Alvin!
I do an estimated compounding across the 10 years and Capital Growths t is about 6.5% for STI Index before dividends. And we are measuring the Index from bottom of trough to the highs. Seems like marketing timing is crucial for Capital Gains.
Thanks for this Alvin. I know this is posted several years ago but there’s something I don’t understand so I need to ask –
Comparing the returns of both ETFs as you did above, I understood the part about currency risk as iShares MSCI Sg is quoted in USD. However on operating expenses as a factor, yes iShares MSCI Sg has a higher operating expense %, but isn’t this already taken into account in the daily NAV calculation and therefore, can we say that DESPITE higher op expenses, iShares MSCI Sg still delivered higher NAV returns than the SPDR STI?
(I’m just using the %returns you quoted above back from 2013 as an illustration)
Alvin: You can say so because they delivered higher returns due to a different portfolio of stocks (40 vs 30 in STI). Note that STI is very heavy into the 3 local banks which constituted half of the market cap in the index. So if banks do well, STI will do well, otherwise STI may underperform.